contents area
Press Release
detail content area
- Date2020-04-15 13:42
- Update2020-04-15 14:12
- DivisionDivision of Risk assessment and International cooperation
- Tel043-719-7556
Updates on COVID-19 in Republic of Korea
15 April, 2020
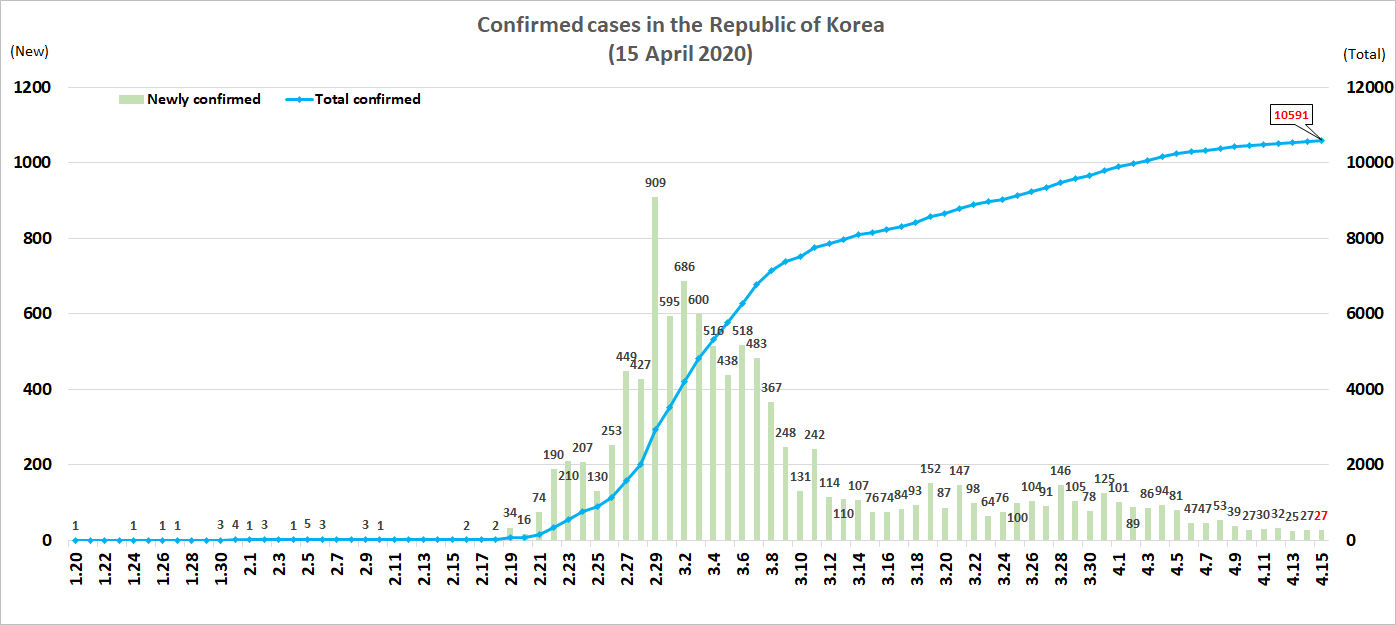
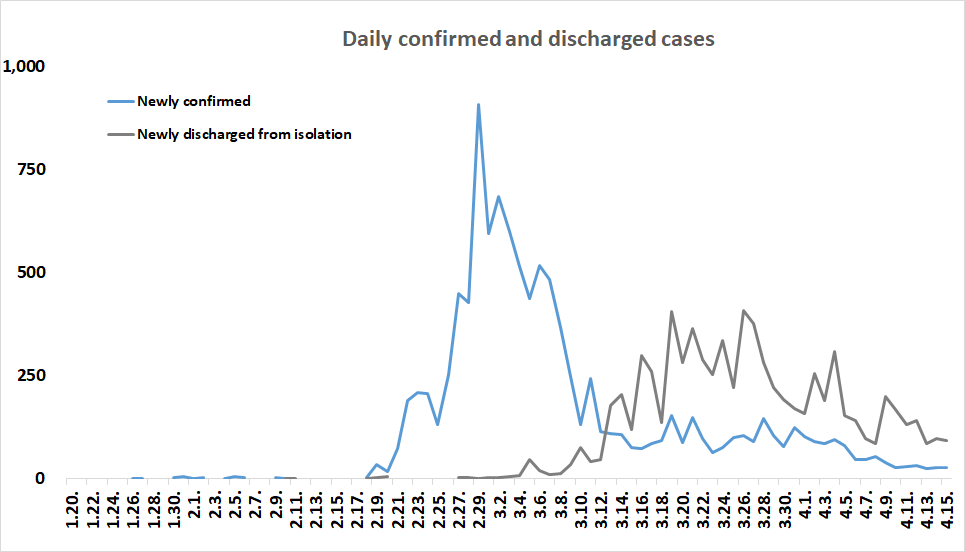
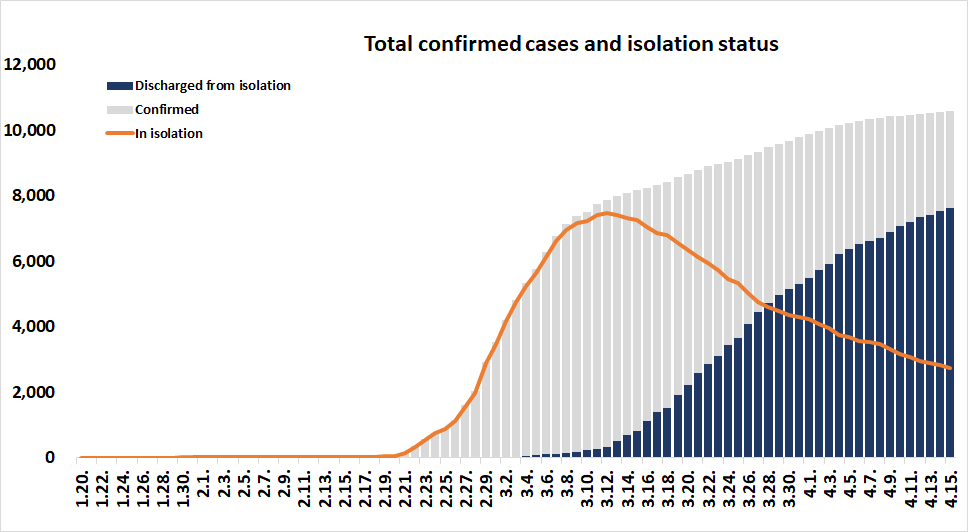
○ As of 0:00, 15 April 2020, the total number of confirmed cases is 10,591 (including 955 imported cases), of which 7,616 cases have been discharged from isolation. Newly confirmed cases are 27 in total.
[Table 1. Total confirmed and suspected cases]
|
Period (since 3 Jan) |
Total |
Tested positive (PCR) |
Being tested |
Tested negative |
|||
|
Confirmed |
Discharged |
Isolated |
Deceased |
||||
|
As of 0:00 14 April (Mon) |
527,438 |
10,564 |
7,534 |
2,808 |
222 |
14,651 |
502,223 |
|
As of 0:00 15 April (Tues) |
534,552 |
10,591 |
7,616 |
2,750 |
225 |
15,026 |
508,935 |
|
Difference |
(+)7,114 |
(+)27 |
(+)82 |
(-)58 |
(+)3 |
(+)375 |
(+)6,712 |
[Table 2. Imported cases in Korea (as of 0:00, 15 April 2020)]
|
|
Total |
Region/Country |
Where confirmed |
Nationality |
||||||
|
China |
Asia ex-China |
Europe |
America |
Africa |
Airport |
Community |
Korean |
Other |
||
|
New |
11 |
0 |
2 |
5 |
4 |
0 |
4 |
7 |
8 |
3 |
|
Total |
955 |
16 |
102 |
429 |
405 |
3 |
393 |
562 |
874 |
81 |
|
(1.7%) |
(10.7%) |
(44.9%) |
(42.4%) |
(0.3%) |
(41.2%) |
(58.8%) |
(91.5%) |
(8.5%) |
||
○ Regional distribution of total confirmed cases:
|
|
Total |
City |
||||||||||||||||
|
Seoul |
Busan |
Daegu |
Incheon |
Gwangju |
Daejeon |
Ulsan |
Sejong |
|||||||||||
|
Isolated |
2,750 |
376 |
17 |
1,182 |
40 |
7 |
15 |
8 |
25 |
|||||||||
|
Discharged |
7,616 |
239 |
107 |
5,486 |
48 |
21 |
24 |
33 |
21 |
|||||||||
|
Deceased |
225 |
2 |
3 |
155 |
0 |
0 |
0 |
1 |
0 |
|||||||||
|
Subtotal |
10,591 |
617 |
127 |
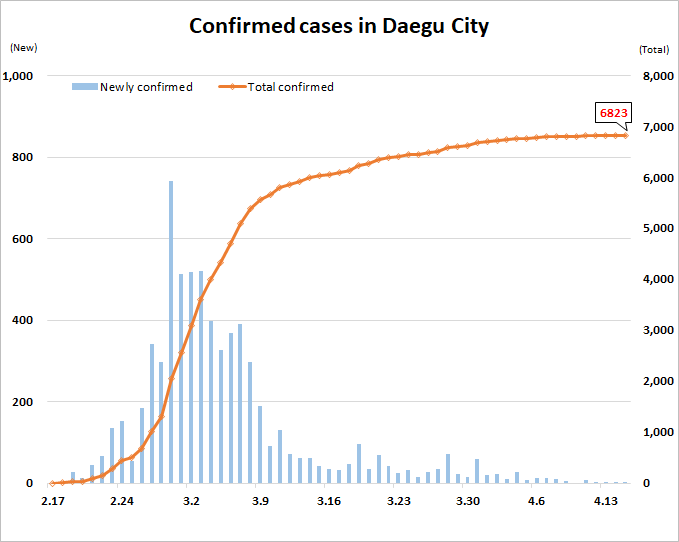
6,823 |
88 |
28 |
39 |
42 |
46 |
|||||||||
|
New (Difference) |
27 |
5 |
1 |
1 |
0 |
1 |
0 |
0 |
0 |
|||||||||
|
|
Province |
Other |
||||||||||||||||
|
Gyeonggi |
Gangwon |
Chung-buk |
Chung- nam |
Jeon- buk |
Jeon- nam |
Gyeong- buk |
Gyeong-nam |
Jeju |
Airport screening |
|||||||||
|
Isolated |
310 |
23 |
14 |
25 |
9 |
8 |
263 |
31 |
8 |
389 |
||||||||
|
Discharged |
322 |
27 |
31 |
114 |
8 |
7 |
1,035 |
84 |
5 |
4 |
||||||||
|
Deceased |
13 |
1 |
0 |
0 |
0 |
0 |
50 |
0 |
0 |
0 |
||||||||
|
Subtotal |
645 |
51 |
45 |
139 |
17 |
15 |
1,348 |
115 |
13 |
393 |
||||||||
|
New (Difference) |
6 |
2 |
0 |
0 |
0 |
0 |
6 |
0 |
1 |
4 |
||||||||
|
|
||||||||||||||||||
○ Case distribution and incidence rate by region:
|
Region |
# of cases |
(%) |
Incidence rate (per 0.1M) |
Region |
# of cases |
(%) |
Incidence rate (per 0.1M) |
|
Seoul |
617 |
(5.83) |
6.34 |
Gyeonggi |
645 |
(6.09) |
4.87 |
|
Busan |
127 |
(1.20) |
3.72 |
Gangwon |
51 |
(0.48) |
3.31 |
|
Daegu |
6,823 |
(64.42) |
280.03 |
Chungbuk |
45 |
(0.42) |
2.81 |
|
Incheon |
88 |
(0.83) |
2.98 |
Chungnam |
139 |
(1.31) |
6.55 |
|
Gwangju |
28 |
(0.26) |
1.92 |
Jeonbuk |
17 |
(0.16) |
0.94 |
|
Daejeon |
39 |
(0.37) |
2.65 |
Jeonnam |
15 |
(0.14) |
0.80 |
|
Ulsan |
42 |
(0.40) |
3.66 |
Gyeongbuk |
1,348 |
(12.73) |
50.63 |
|
Sejong |
46 |
(0.43) |
13.44 |
Gyeongnam |
115 |
(1.09) |
3.42 |
|
Airport Screening |
393 |
(3.71) |
- |
Jeju |
13 |
(0.12) |
1.94 |
|
|
Total |
10,591 |
(100) |
20.43 |
[Table 3: Regional distribution and epidemiological links of the confirmed cases]
|
Region |
Confirmed cases |
Other major clusters |
||||||||
|
Total |
Imported cases |
Clusters |
Other* |
New cases |
||||||
|
Sub- total |
Shin- cheonji |
Small clusters |
Contacts of confirmed cases |
Imported cases |
||||||
|
Seoul |
617 |
238 |
356 |
8 |
262 |
19 |
67 |
23 |
5 |
Guro-gu call center (98), Dong-an Church-PC Cafe (20), Manmin Central Church (41), etc. |
|
Busan |
127 |
17 |
81 |
12 |
50 |
18 |
1 |
29 |
1 |
Onchun Church (39), Suyeong-gu Kindergarten (5), etc. |
|
Daegu |
6,823 |
16 |
6,090 |
4,509 |
655 |
922 |
4 |
717 |
1 |
Second Mi-Ju Hospital (193), Hansarang Convalescent Hospital (126), Daesil Convalescent Hospital (99), Fatima Hospital (36), etc. |
|
Incheon |
88 |
37 |
47 |
2 |
34 |
5 |
6 |
4 |
0 |
Guro-gu call center (20), etc. |
|
Gwangju |
28 |
11 |
16 |
9 |
0 |
1 |
6 |
1 |
1 |
|
|
Daejeon |
39 |
9 |
21 |
2 |
11 |
8 |
0 |
9 |
0 |
Korea Forest Engineer Institute (3), etc. |
|
Ulsan |
42 |
11 |
24 |
16 |
1 |
4 |
3 |
7 |
0 |
|
|
Sejong |
46 |
3 |
42 |
1 |
38 |
3 |
0 |
1 |
0 |
Ministry of Oceans and Fisheries (30), gym facilities (8) |
|
Gyeonggi |
645 |
146 |
457 |
29 |
312 |
59 |
57 |
42 |
6 |
Grace River Church in Seongnam (72), Guro-gu call center-Bucheon SaengMyeongSu Church (48), Uijeongbu St. Mary’s Hospital (47), etc. |
|
Gangwon |
51 |
13 |
31 |
17 |
14 |
0 |
0 |
7 |
2 |
Apartments in Wonju City (3), Euijeongbu St. Mary’s Hospital (9), etc. |
|
Chung-buk |
45 |
5 |
32 |
6 |
18 |
6 |
2 |
8 |
0 |
Goesan-gun Jangyeon-myeon (11) |
|
Chung-nam |
139 |
10 |
120 |
0 |
118 |
1 |
1 |
9 |
0 |
Gym facilities in Cheonan (103), research center in Seosan (9), etc. |
|
Jeonbuk |
17 |
8 |
4 |
1 |
3 |
0 |
0 |
5 |
0 |
|
|
Jeonnam |
15 |
7 |
7 |
1 |
3 |
2 |
1 |
1 |
0 |
Manmin Central Church (2) |
|
Gyeong-buk |
1,348 |
9 |
1,205 |
566 |
446 |
192 |
1 |
134 |
6 |
Cheongdo Daenam Hospital (120), Bonghwa Pureun Nursing Home (68), pilgrimage to Israel (49), Gyeongsan Seo Convalescent Hospital (66), Yechun-gun (25) etc. |
|
Gyeong-nam |
115 |
14 |
84 |
32 |
45 |
6 |
1 |
17 |
0 |
Geochang Church (10), Geochang Woongyang-myeon (8), Wings Tower (10), etc. |
|
Jeju |
13 |
8 |
1 |
0 |
0 |
0 |
1 |
4 |
1 |
|
|
Airport |
393 |
393 |
0 |
0 |
0 |
0 |
0 |
0 |
4 |
|
|
Total |
10,591 |
955 |
8,618 |
5,211 |
2,010 |
1,246 |
151 |
1,018 |
27 |
|
|
(9.0) |
(81.4) |
(49.2) |
(19.0) |
(11.8) |
(1.4) |
(9.6) |
||||
|
* Not classified into a cluster or under investigation ※ The interim classification is based on the reporting location, which may change depending on further epidemiological investigation. |
||||||||||
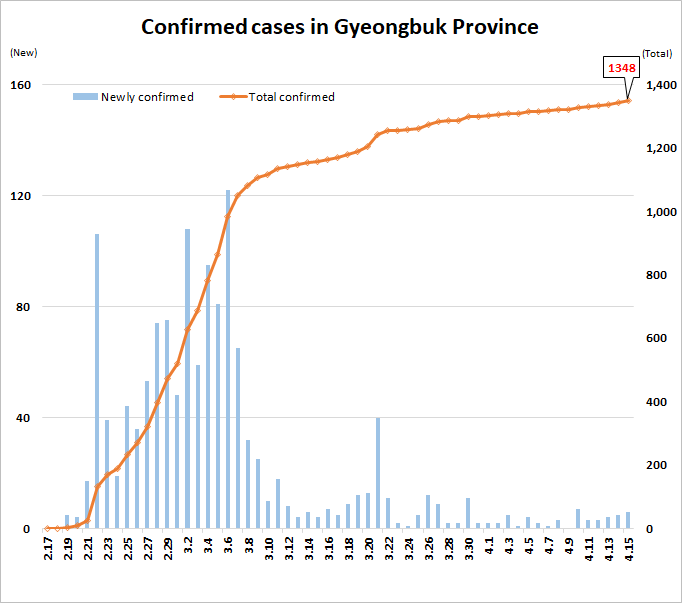
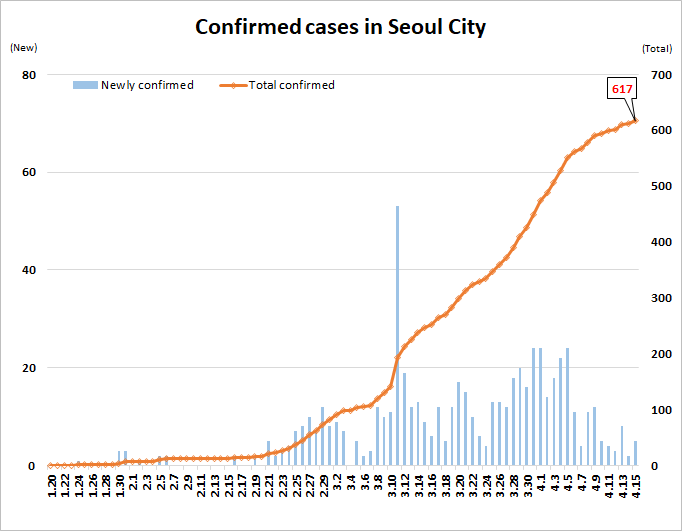
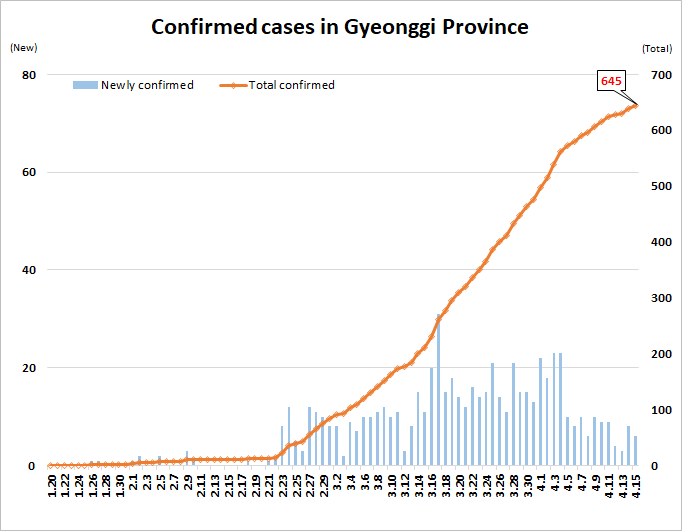
○ Daily case trends by region:
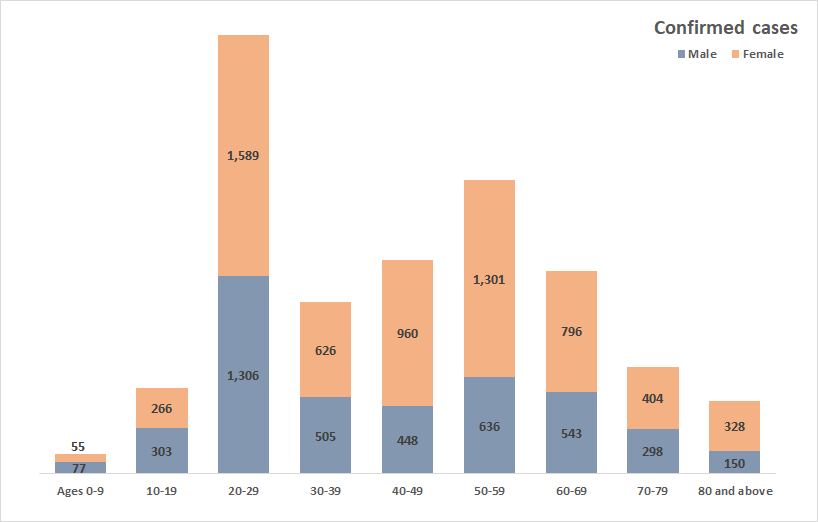
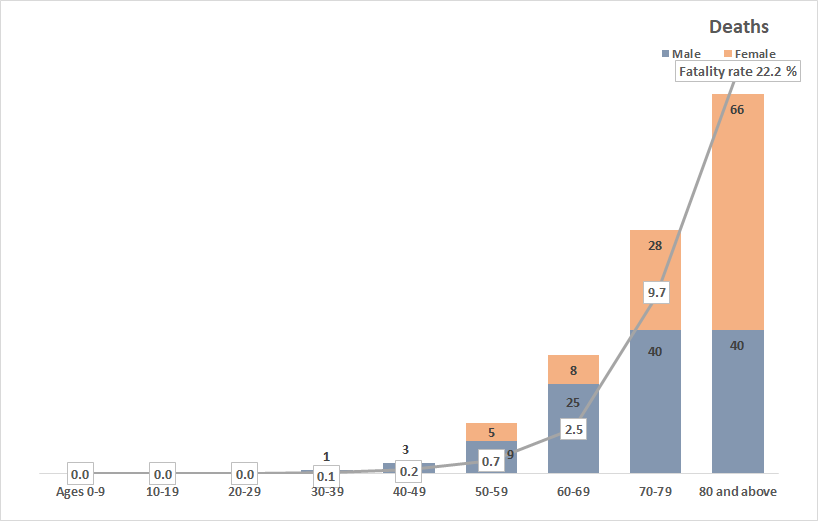
○ Case distribution by gender and age group:
|
|
Confirmed Cases |
(%) |
Deaths |
(%) |
Fatality rate (%) |
|
|
Total |
10,591 |
(100) |
225 |
(100) |
2.12 |
|
|
Sex |
Male |
4,266 |
(40.28) |
118 |
(52.44) |
2.77 |
|
Female |
6,325 |
(59.72) |
107 |
(47.56) |
1.69 |
|
|
Age |
80 and above |
478 |
(4.51) |
106 |
(47.11) |
22.18 |
|
70-79 |
702 |
(6.63) |
68 |
(30.22) |
9.69 |
|
|
60-69 |
1,339 |
(12.64) |
33 |
(14.67) |
2.46 |
|
|
50-59 |
1,937 |
(18.29) |
14 |
(6.22) |
0.72 |
|
|
40-49 |
1,408 |
(13.29) |
3 |
(1.33) |
0.21 |
|
|
30-39 |
1,131 |
(10.68) |
1 |
(0.44) |
0.09 |
|
|
20-29 |
2,895 |
(27.33) |
0 |
(0.00) |
- |
|
|
10-19 |
569 |
(5.37) |
0 |
(0.00) |
- |
|
|
0-9 |
132 |
(1.25) |
0 |
(0.00) |
- |
|
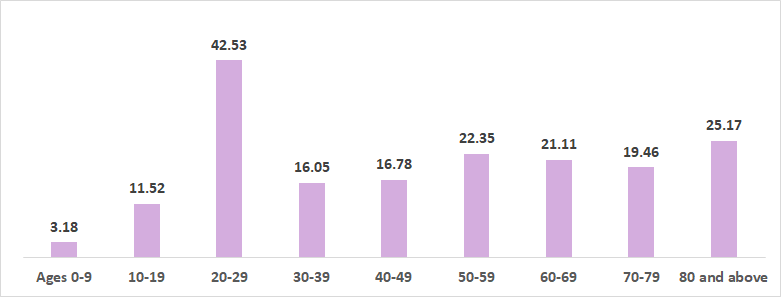
○ Incidence rate by age group (per 100,000):
[Table 4: Age distribution of severe cases]
|
Age group |
Total |
Severe |
( |
% |
) |
Very severe |
( |
% |
) |
|
Total |
65 |
23 |
( |
100.0 |
) |
42 |
( |
100.0 |
) |
|
80 and above |
10 |
3 |
( |
13.0 |
) |
7 |
( |
16.7 |
) |
|
70-79 |
31 |
12 |
( |
52.2 |
) |
19 |
( |
45.2 |
) |
|
60-69 |
13 |
3 |
( |
13.0 |
) |
10 |
( |
23.8 |
) |
|
50-59 |
6 |
3 |
( |
13.0 |
) |
3 |
( |
7.1 |
) |
|
40-49 |
3 |
0 |
( |
0.0 |
) |
3 |
( |
7.1 |
) |
|
30-39 |
0 |
0 |
( |
0.0 |
) |
0 |
( |
0.0 |
) |
|
20-29 |
2 |
2 |
( |
8.7 |
) |
0 |
( |
0.0 |
) |
|
10-19 |
0 |
0 |
( |
0.0 |
) |
0 |
( |
0.0 |
) |
|
0-9 |
0 |
0 |
( |
0.0 |
) |
0 |
( |
0.0 |
) |
[Table 5: Age distribution of reconfirmation cases]
|
Age group |
Total |
( |
% |
) |
|
Total |
133 |
( |
100.0 |
) |
|
80 and above |
13 |
( |
9.8 |
) |
|
70-79 |
5 |
( |
3.8 |
) |
|
60-69 |
15 |
( |
11.3 |
) |
|
50-59 |
25 |
( |
18.8 |
) |
|
40-49 |
16 |
( |
12.0 |
) |
|
30-39 |
20 |
( |
15.0 |
) |
|
20-29 |
30 |
( |
22.6 |
) |
|
10-19 |
6 |
( |
4.5 |
) |
|
0-9 |
3 |
( |
2.3 |
) |
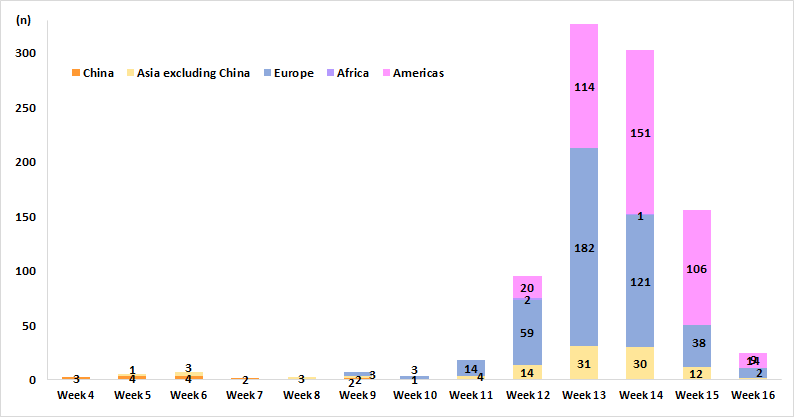
○ Weekly trend of imported cases:
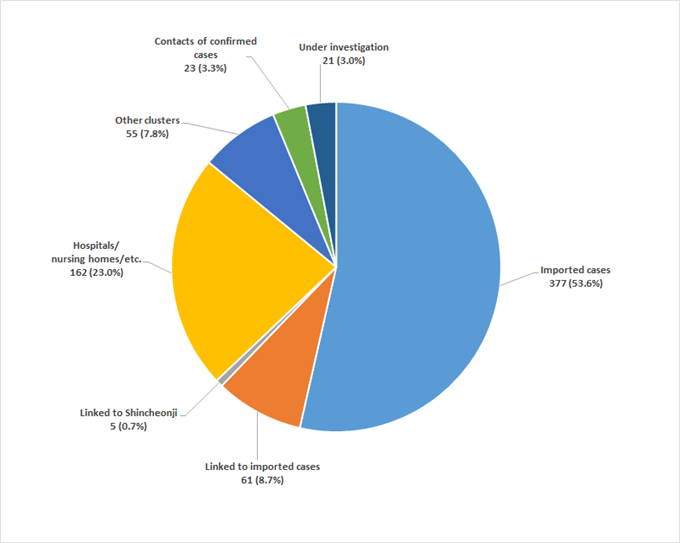
[Figure 1: New cases (for last 2 weeks) by chain of transmission]
 This public work may be used under the terms of the public interest source + commercial use prohibition + nonrepudiation conditions