contents area
주간건강과질병
detail content area
[QuickStats] 가공식품 선택 시 영양표시 이용률 추이, 2008-2016
- 작성일2019-01-31
- 최종수정일2021-04-15
- 담당부서만성질환관리과
- 연락처043-719-7383
가공식품 선택 시 영양표시 이용률 추이, 2008-2016
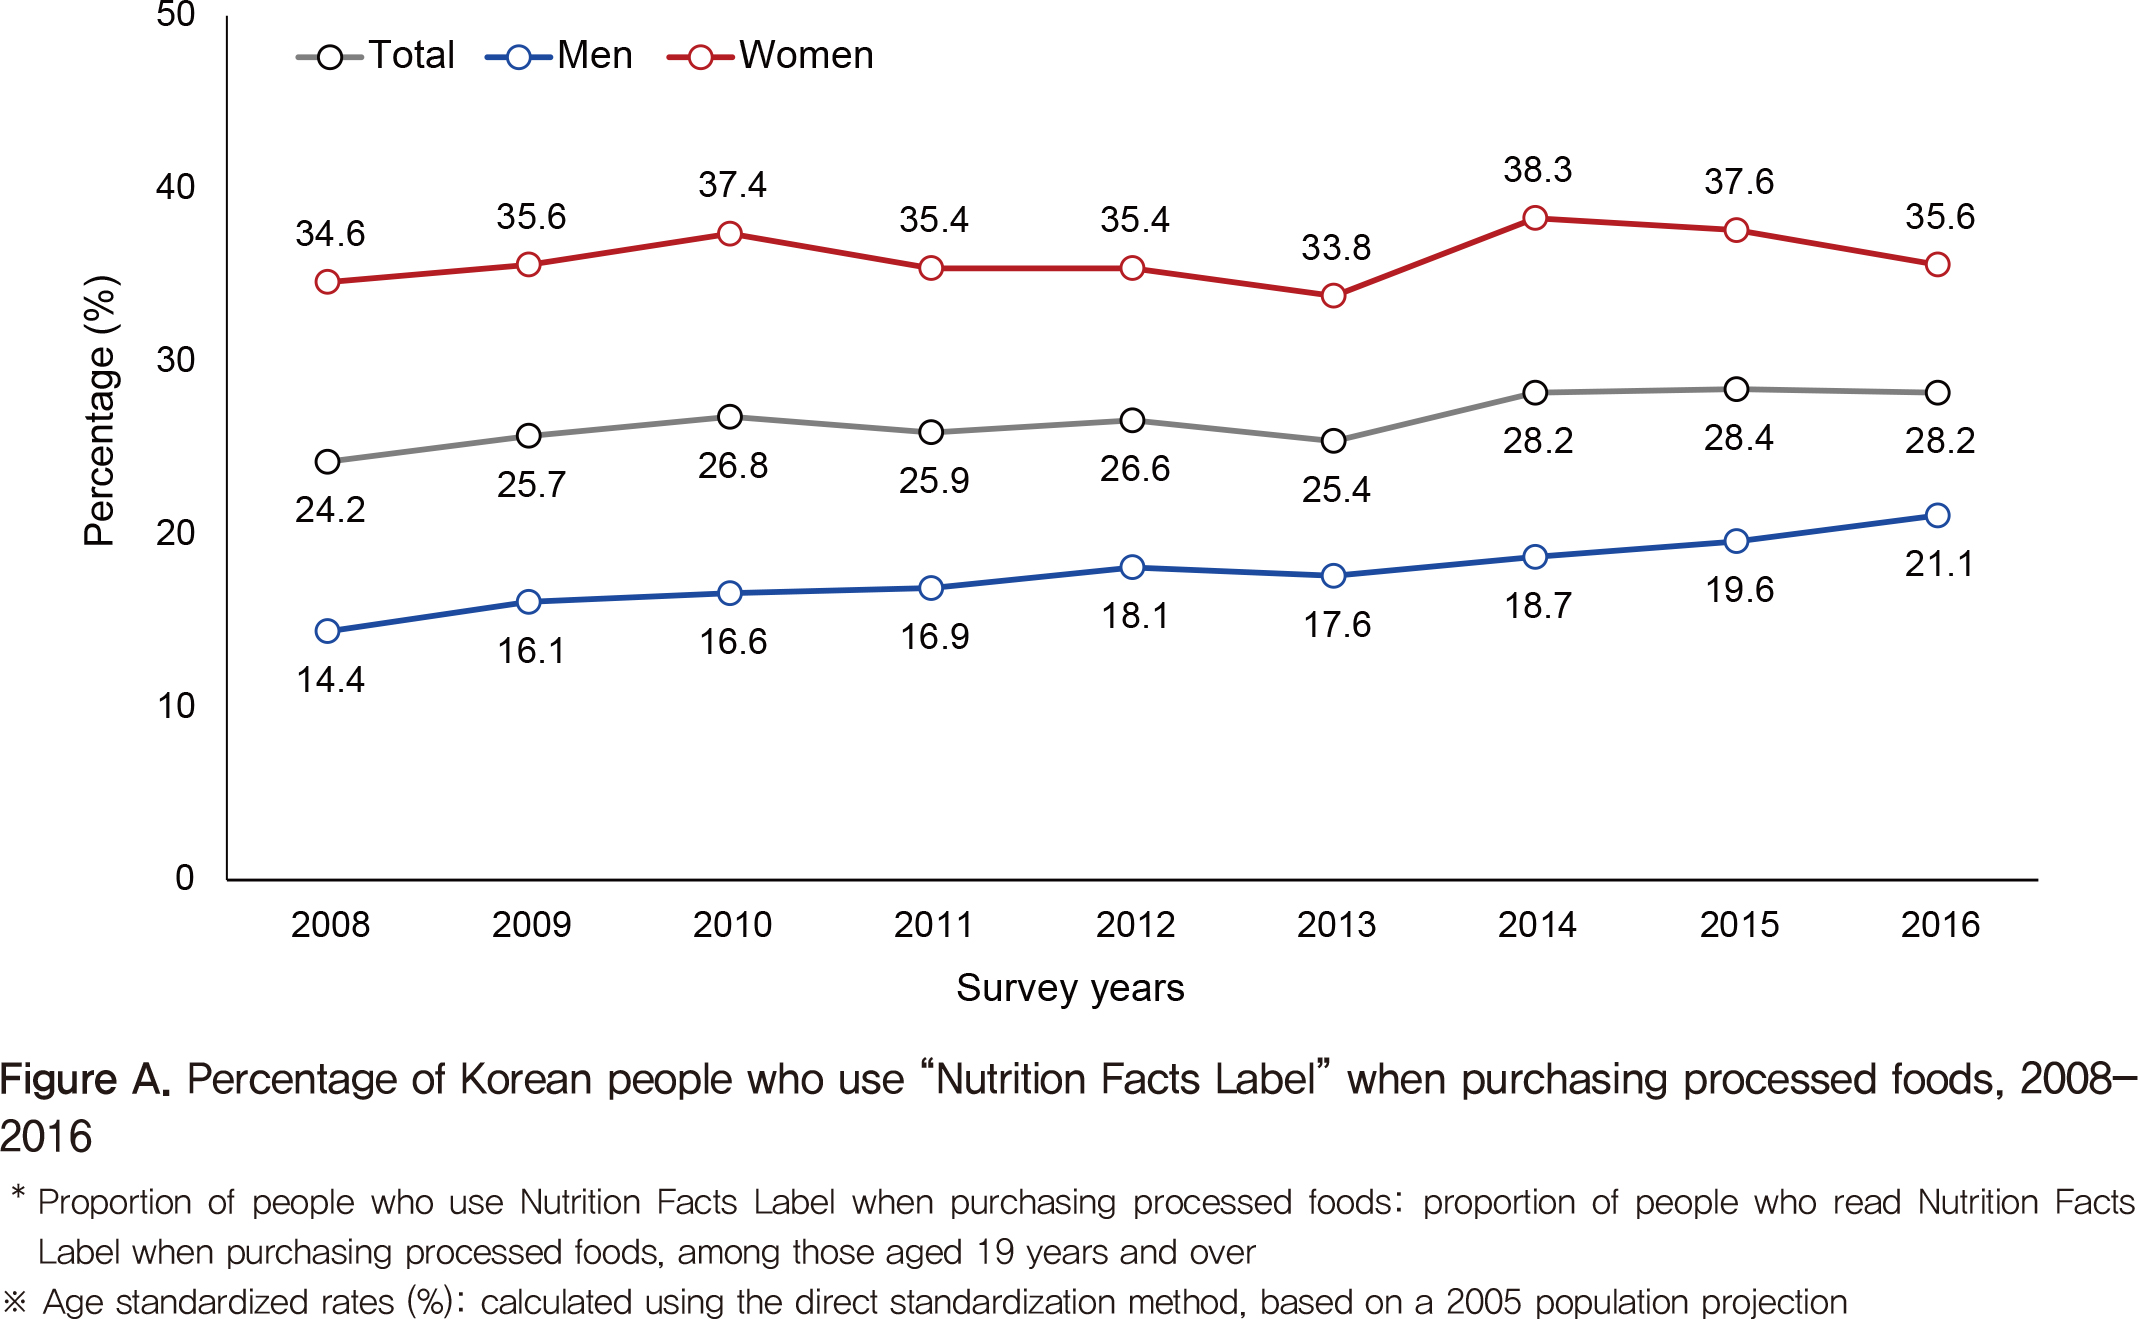
Percentage of Korean people who use “Nutrition Facts Label” when purchasing processed foods, 2008-2016
[정의] 가공식품 선택 시 영양표시 이용률 : 가공식품 선택 시 영양표시를 읽는 분율, 만19세 이상
만19세 이상에서 가공식품 선택 시 영양표시 이용률(연령표준화)은 2008년 24.2%에서 2016년 28.2%로 4.0%p 증가(남자는 14.4%에서 21.1%로 6.7%p 증가, 여자는 34.6%에서 35.6%로 1.0%p 증가)하였음. 2016년 기준 여자의 영양표시 이용률은 35.6%로 남자(21.1%)에 비해 약1.7배 높았음(Figure A).
The percentage of people who read “Nutrition Facts Label” when purchasing processed foods, among those aged 19 years and over increased by 4.0%p, from 24.2% in 2008 to 28.2% in 2016. Specifically, the percentage among men rose from 14.4% to 21.1%, by 6.7 percentage points (%p), and that among women rose from 34.6% to 35.6%, by 1%p. Based on the 2016 data, the percentage in women (35.6%) was 1.7 folds higher than males (21.1%) (Figure A).
Source: Korea Health Statistics 2016, Korea National Health and Nutrition Examination Survey, http://knhanes.kdca.go.kr/
Reported by: Division of Chronic Disease Control, Korea Centers for Disease Control and Prevention
 본 공공저작물은 공공누리 "출처표시+상업적이용금지+변경금지" 조건에 따라 이용할 수 있습니다.