컨텐츠 영역
Providing Scientific Evidence for Quarantine Policies
Overview
- Strengthening ongoing infectious disease response capabilities after the end of the COVID-19 pandemic and enhancing the infectious disease prediction system to prepare for future pandemics
About the task
- Predicting the scale of ongoing infectious diseases such as COVID-19 and influenza to provide a basis for quarantine response
- Identifying the latest technological trends from various fields such as AI, statistics, and mathematics, and promoting the development and enhancement of prediction methodologies based on this
- Promoting the establishment of a collaboration system with private prediction experts to minimize prediction uncertainty caused by changes in various factors such as population behavior and virus characteristics
Infectious Disease Prediction Analysis Cases
-
<2024 Summer COVID-19 ARI Prediction>
-
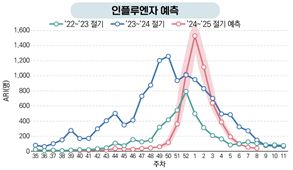
<24-25 Season Winter Influenza ARI Prediction>
The image consists of two graphs showing case studies of infectious disease prediction analysis.
Left Graph: 2024 Summer COVID-19 ARI Prediction
- The vertical axis represents the number of ARI (Acute Respiratory Infection) patients, and the horizontal axis represents the weeks (Week 1 to Week 41).
- The actual number of hospitalized patients (green line) sharply increased between Weeks 28 and 34, reaching a peak of over 1,400 patients, and then showed a decreasing trend.
- The predicted result (red dotted line) continued to decrease after Week 36, and by Week 40, it was expected to drop to about 200 patients or less.
Right Graph: 2024–2025 Winter Influenza ARI Prediction
- The vertical axis represents the number of ARI patients, and the horizontal axis represents the weeks (Week 36 to Week 11).
- The "2022–2023 season" (green line) remained at relatively low levels.
- The "2023–2024 season" (blue line) peaked at around 1,000 patients in Week 51.
- The "2024–2025 season forecast" (pink line) is expected to increase more steeply than before, reaching a peak of about 1,400 patients in Week 52, and then decrease sharply over the next 3–5 weeks.
Overall, the 2024 COVID-19 pandemic is expected to peak in the summer and then decline, while the influenza season in 2024–2025 is predicted to have a stronger winter surge compared to previous years.
Left Graph: 2024 Summer COVID-19 ARI Prediction
- The vertical axis represents the number of ARI (Acute Respiratory Infection) patients, and the horizontal axis represents the weeks (Week 1 to Week 41).
- The actual number of hospitalized patients (green line) sharply increased between Weeks 28 and 34, reaching a peak of over 1,400 patients, and then showed a decreasing trend.
- The predicted result (red dotted line) continued to decrease after Week 36, and by Week 40, it was expected to drop to about 200 patients or less.
Right Graph: 2024–2025 Winter Influenza ARI Prediction
- The vertical axis represents the number of ARI patients, and the horizontal axis represents the weeks (Week 36 to Week 11).
- The "2022–2023 season" (green line) remained at relatively low levels.
- The "2023–2024 season" (blue line) peaked at around 1,000 patients in Week 51.
- The "2024–2025 season forecast" (pink line) is expected to increase more steeply than before, reaching a peak of about 1,400 patients in Week 52, and then decrease sharply over the next 3–5 weeks.
Overall, the 2024 COVID-19 pandemic is expected to peak in the summer and then decline, while the influenza season in 2024–2025 is predicted to have a stronger winter surge compared to previous years.
Progress
- Systematic organization of the main forecasting models used during the COVID-19 period and develop the Korea Disease Control and Prevention Agency’s own model
- Providing a basis for decision-making in quarantine policies through predictions of the COVID-19 outbreak in summer 2024 and influenza outbreaks in winter
- Promoting the establishment of a collaboration system with private prediction experts
- Promoting research on the development of spatial and temporal simulations in preparation for pandemics
Direction of work promotion
- Performing short-term predictions and medium-to-long-term outlooks through collaboration with private experts during infectious disease outbreaks, and quantitatively analyzing the effectiveness of quarantine measures to support decision-making based on scientific evidence
- Supporting the establishment of effective quarantine strategies from the early stages of a pandemic by building sophisticated simulation models and predicting infection transmission patterns and the effectiveness of quarantine measures across regions in advance to prepare for future pandemics