컨텐츠 영역
Status of High-risk Pathogen Management (as of December 2024)
* Infectious disease pathogens that can be used for bioterrorism or pose a serious risk to public health in the event of accidents or external leaks (including 8 types of bioterrorism infectious disease pathogens and 39 kinds of high-risk pathogens)
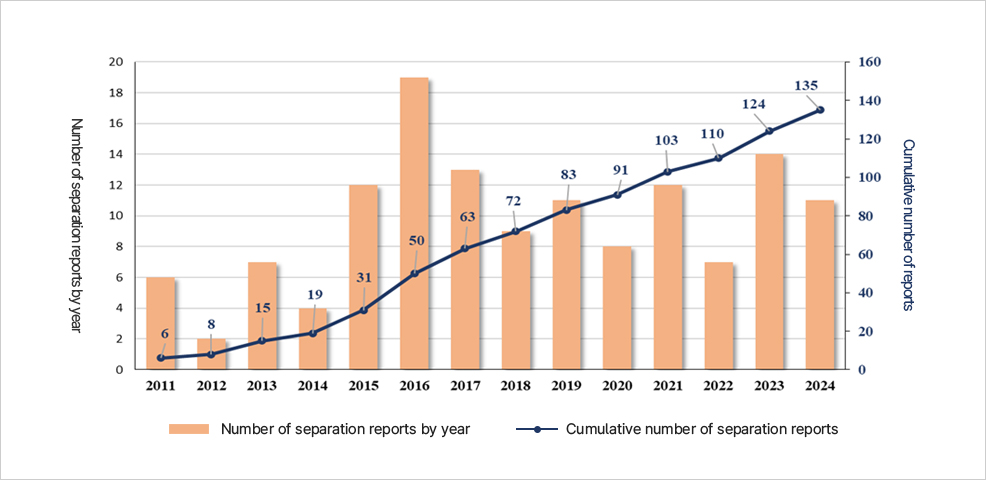
Status of high-risk pathogen separation reporting
| 2011 | 2012 | 2013 | 2014 | 2015 | 2016 | 2017 | 2018 | 2019 | 2020 | 2021 | 2022 | 2023 | 2024 | |
|---|---|---|---|---|---|---|---|---|---|---|---|---|---|---|
| Number of Isolation Reports by Year | 6 | 2 | 7 | 4 | 12 | 19 | 13 | 9 | 11 | 8 | 12 | 7 | 14 | 11 |
| Cumulative Number of Isolation Reports | 6 | 8 | 15 | 19 | 31 | 50 | 63 | 72 | 83 | 91 | 103 | 110 | 124 | 135 |
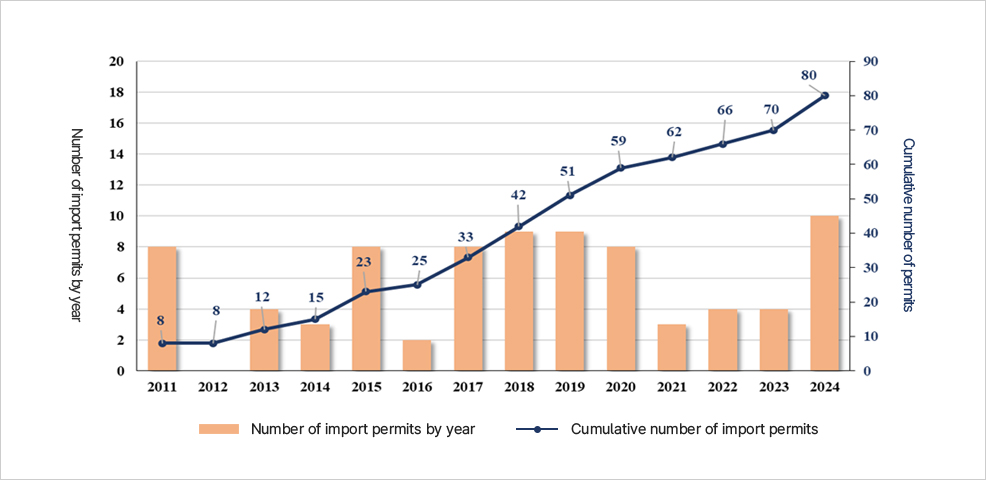
Status of high-risk pathogen import permits
This graph shows the changes in the number of import permits and the cumulative number from 2011 to 2024. The orange bars represent the annual number, and the navy blue line represents the cumulative number (unit: cases).
- 2011~2014: Maintained at 8-15 cases annually.
- 2015~2016: A sharp increase, reaching peaks of 23 cases and 25 cases, respectively.
- 2017: After a decrease, it stabilized at around 8 cases.
- 2018~2020: Increased again to around 9-10 cases annually.
- 2021~2023: Fluctuated between mid-to-late single digits.
- 2024: Increased again to the low double digits.
- Cumulative Number: 33 cases in 2017, 42 cases in 2018, 51 cases in 2019, 59 cases in 2020, 62 cases in 2021, 66 cases in 2022, 70 cases in 2023, and 80 cases in 2024.
Meaning: While the annual number fluctuates, the cumulative number has steadily increased, reaching 80 cases in 2024.
Status of national safety management of biosafety facilities (as of December 2024)
Permits and reports for biosafety research facilities (genetically modified organism research facilities) and high-risk pathogen handling facilities under the Living Modified Organisms Act and the Infectious Disease Control and Prevention Act, as well as safety management of the facilities
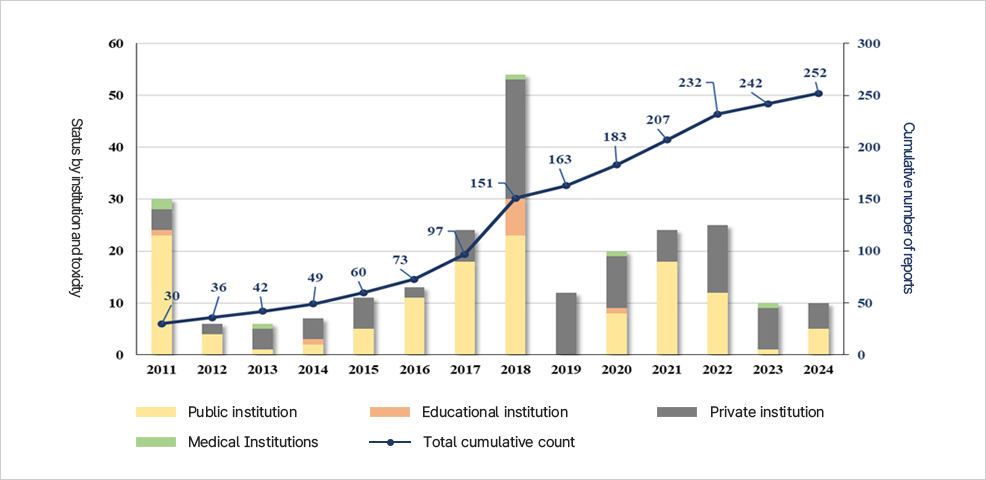
Status of Biosafety Level 2 facilities
This graph shows the report status of Biosafety Level 2 facilities from 2011 to 2024. The bar graph shows the annual number of cases by institution type, while the line graph represents the total cumulative cases.
- Institution Types: Public institutions (yellow), educational institutions (orange), private institutions (gray), medical institutions (light green).
- 2011: Started with a total of 30 cases.
- 2012~2016: Annual cases remained around 10-20, and the cumulative number steadily increased (73 cases in 2016).
- 2017: Cumulative total reached 97 cases.
- 2018: A significant increase in new reports by institutions, with over 50 cases, bringing the cumulative total to 151 cases.
- 2019~2020: Annual reports slightly decreased, but cumulative cases increased to 163 and 183, respectively.
- 2021~2022: Annual cases increased again, with cumulative totals of 232 and 242 cases.
- 2023~2024: Annual cases decreased to single digits, with the cumulative total reaching 252 cases by the end of 2024.
Meaning: Since 2011, the number of facilities has steadily increased, with a sharp rise in 2018. By 2024, a total of 252 cases have been reported. The majority of institutions are public and private institutions.
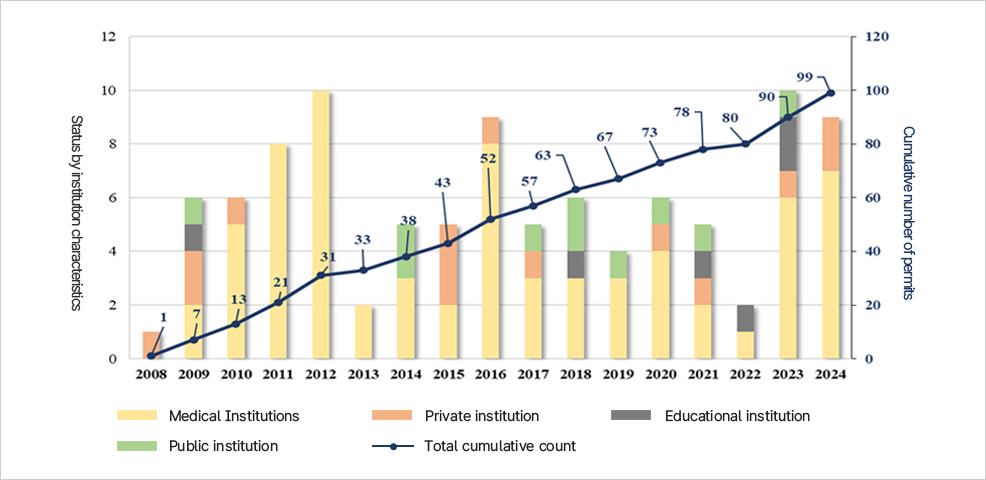
Status of Biosafety Level 3 facilities
This graph shows the report and approval status of Biosafety Level 3 facilities from 2008 to 2024. The bar graph represents the annual number of cases by institution type (public institutions, educational institutions, private institutions, and medical institutions), while the line graph shows the total cumulative approval cases.
- 2008~2010: Initially, the number of cases was between 1 and 7 per year, with the cumulative total increasing to 7 cases.
- 2011~2013: The number of cases increased mainly in public institutions, reaching a cumulative total of 31 cases.
- 2014~2016: Although there were fluctuations in annual cases, the number steadily increased, expanding to a cumulative total of 52 cases.
- 2017~2019: Annual cases remained around 5 to 6, with the cumulative total rising from 67 cases to 73 cases.
- 2020~2022: Annual cases decreased, but the cumulative total reached 80 cases.
- 2023: A significant increase in new reports led to a cumulative total of 99 cases.
- 2024: A slight increase brought the cumulative total to 100 cases.
Meaning: Biosafety Level 3 facilities have steadily increased since 2008, reaching 100 cases by 2024. Public institutions make up the majority, but in recent years, private and educational institutions have been steadily increasing as well.
Status of National Management of Living Modified Organisms (LMOs) (as of December 2024)
- LMOs using pathogenic microorganisms that require national management
- LMOs producing protein toxins
- LMOs containing drug resistance genes
- LMOs using unidentified organisms
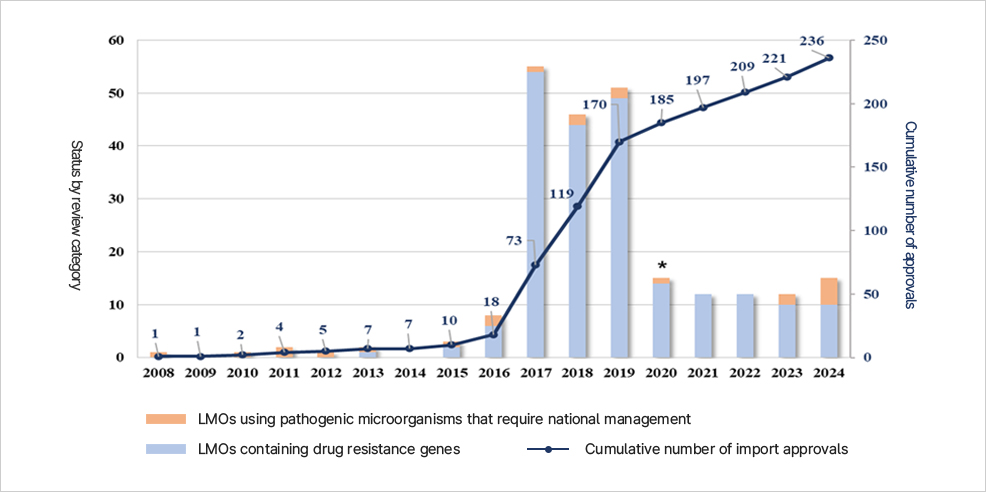
Status of import approvals for LMOs for testing and research purposes
This graph shows the import approval status of genetically modified organisms (GMOs) for experimental and research use from 2008 to 2024. The bar graph represents the number of approvals categorized by type, while the line graph shows the total cumulative direct import approval cases.
- 2008~2015: The annual approval cases remained low, around 1 to 10 cases per year.
- 2016: The number of approvals increased to 18, with a cumulative total of 73 cases.
- 2017~2018: A sharp rise occurred, with 119 cases in 2017 and 170 cases in 2018, reaching the highest level.
- 2019: The number increased to 185 cases, but a declining trend followed thereafter.
- 2020~2024: The number of annual approvals remained around 10, with the cumulative total steadily increasing, reaching 236 cases in 2024.
- Category: The orange bars represent GMOs using pathogenic microorganisms that require national management, while the blue bars represent GMOs containing drug-resistant genes.
Meaning: Initially, the approval numbers were low, but since 2016, there has been a sharp increase, reaching a peak in 2018. Although the numbers decreased afterward, the cumulative approvals have steadily increased, reaching 236 cases by 2024.
Status of development and experimentation approvals for LMOs for testing and research purposes
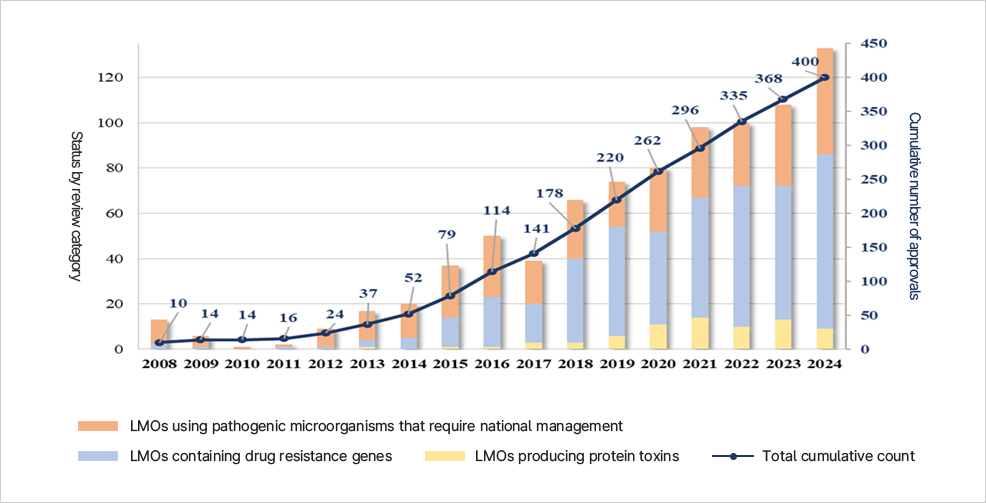
This graph shows the development and experiment approval status of genetically modified organisms (GMOs) for experimental and research use from 2008 to 2024. The bar graph categorizes the approval cases by type, while the line graph represents the total cumulative approval cases.
- Type Categories: The orange bars represent GMOs using pathogenic microorganisms that require national management, the blue bars represent GMOs containing drug-resistant genes, and the yellow bars represent GMOs producing protein toxins.
- 2008~2012: The annual number of approvals remained in the single-digit range (10-16 cases).
- 2013~2015: The number gradually increased, reaching 37 cases in 2015, with a cumulative total of 79 cases.
- 2016~2018: A sharp increase in approvals, with 52 cases in 2016, 79 cases in 2017, and 114 cases in 2018, bringing the cumulative total to 178 cases.
- 2019~2021: The annual approval count remained around 100 cases, with the cumulative total increasing to 262 cases in 2019, 296 cases in 2020, and 335 cases in 2021.
- 2022~2024: Continued growth, reaching 368 cases in 2022 and 400 cases in 2024.
Meaning: The number of approvals for the development and experiment of GMOs for research and experimentation saw a sharp increase after 2016, reaching a total of 400 cases by 2024. Notably, GMOs containing drug-resistant genes and those using pathogenic microorganisms make up the majority.