컨텐츠 영역
New HIV/AIDS Report Status
In 2023, a total of 1,005 new cases were reported, including 749 Korean nationals and 256 foreigners
- By gender, there were 903 males and 102 females, indicating a sex ratio of 9:1.
- Among citizens, there were 718 males and 31 females, with males accounting for 95.8%, while among foreigners, there were 185 males and 71 females, with males making up 72.2%.
- The age distribution shows that those in their 30s had the highest percentage at 35.4% (356 people), followed by those in their 20s at 28.7% (288 people), and those in their 40s at 15.7% (158 people), with individuals in their 20s to 40s accounting for 79.8% of the total.
- Among citizens, the highest percentage was in the 30s at 33.6% (252 people), while among foreigners, the highest percentage was also in the 30s at 40.6% (104 people).
- The reporting institutions included hospitals and clinics at 63.4% (637 people), public health centers at 28.3% (284 people), and others at 8.4% (84 people).
(Unit: persons)
| Category | Overall | Ratio | Citizens / Foreigners | |
|---|---|---|---|---|
| Citizens | Foreigners | |||
| Gender | Male | 903 | 718 | 185 |
| Female | 102 | 31 | 71 | |
| Age | 0-9 years | 0 | 0 | 0 |
| 10-19 years | 12 | 8 | 4 | |
| 20-29 years | 288 | 226 | 62 | |
| 30-39 years | 356 | 252 | 104 | |
| 40-49 years | 158 | 102 | 56 | |
| 50-59 years | 120 | 97 | 23 | |
| 60-69 years | 55 | 48 | 7 | |
| 70 years and older | 16 | 16 | 0 | |
| Reporting agency | Hospitals and clinics | 637 | 457 | 180 |
| Public health centers | 284 | 222 | 62 | |
| Others | 84 | 70 | 14 | |
2023 HIV/AIDS Domestic Status
As of 2023, there are 16,467 domestic HIV/AIDS cases, with 93.8% (15,448) being male and 6.2% (1,019) being female.
2023 HIV/AIDS Domestic Status by Gender and Age
(Unit: persons)
| Category | Overall | Ratio | Citizens/Foreigners | |
|---|---|---|---|---|
| 16,467 | 100 | Citizens (15,448명, 94.8%) |
Foreigners (1,019명, 6.2%) |
|
| 0~4 years | 0 | 0.0 | 0 | 0 |
| 5~9 years | 0 | 0.0 | 0 | 0 |
| 10~14 years | 1 | 0.0 | 1 | 0 |
| 15~19 years | 17 | 0.1 | 16 | 1 |
| 20~24 years | 292 | 1.8 | 280 | 12 |
| 25~29 years | 1,346 | 8.2 | 1,325 | 21 |
| 30~34 years | 2,511 | 15.2 | 2,462 | 49 |
| 35~39 years | 1,977 | 12.0 | 1,884 | 93 |
| 40~44 years | 1,664 | 10.1 | 1,557 | 107 |
| 45~49 years | 1,936 | 11.8 | 1,825 | 111 |
| 50~54 years | 1,800 | 10.9 | 1,683 | 117 |
| 55~59 years | 1,729 | 10.5 | 1,599 | 130 |
| 60~64 years | 1,308 | 7.9 | 1,195 | 113 |
| 65~69 years | 995 | 5.8 | 827 | 128 |
| 70 years and older | 931 | 5.7 | 794 | 137 |
HIV/AIDS Management Indicators
Treatment Rate
- Definition : The proportion of people diagnosed with HIV infection who are on antiviral medication
- Source : Medical institution billing details (National Health Insurance Service), HIV/AIDS reporting status (Korea Disease Control Agency)
- Calculation formula : The number of individuals with at least one medical record of antiviral therapy (ati-retroviral therapy, ART) prescribed by June of the following year among those billed for “HIV-related illnesses” divided by the number of living HIV-infected individuals for each year (Limitations) The denominator excludes the number of anonymously reported infections, while the numerator includes the number of anonymously reported infections. (Limitations) The survival status of individuals is limited to nationals, and the analysis of medical and treatment personnel is also based on nationals.
Viral Suppression Rate
- Definition : The proportion of individuals on antiviral medication whose blood HIV viral load is suppressed below a certain level
- Calculation formula : The number of individuals registered through the “Medical Institution Infected Person Counseling Project” whose RNA value from the last examination date of the reference year is less than 1,000 copies/mL* divided by the number of individuals registered with at least one RNA value through the “Medical Institution Infected Person Counseling Project” in the reference year. Basis: Consolidated guidelines on the use of antiretroviral drugs for treating and preventing HIV infection. WHO(2016)
Calculation Results
| Year | Number of living HIV-infected individuals | Number of actual patients | Number of actual treated individuals | Treatment rate (%) | Viral suppression rate (%) |
|---|---|---|---|---|---|
| 2017 | 12,320 | 11,451 | 11,190 | 90.8 | 90.9 |
| 2018 | 12,991 | 12,338 | 12,129 | 93.4 | 93.0 |
| 2019 | 13,857 | 13,310 | 13,119 | 94.7 | 94.9 |
| 2020 | 14,538 | 13,934 | 13,766 | 94.7 | 96.9 |
| 2021 | 15,196 | 14,690 | 14,505 | 95.5 | 96.0 |
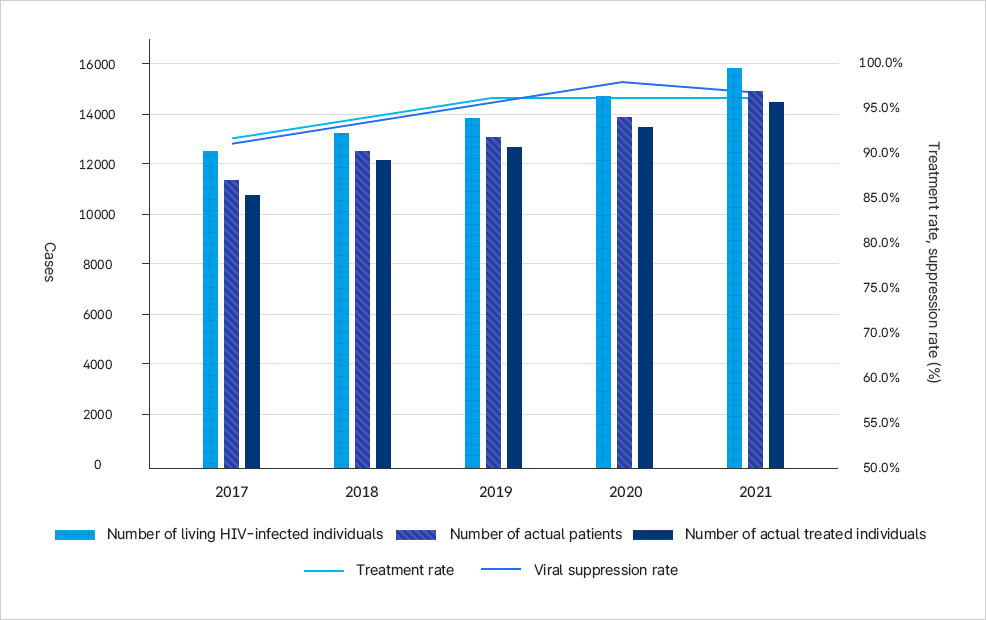
Treatment Rate and Viral Suppression Rate for HIV-infected Individuals
(based on nationals, December 20, 2022)
| 2017 | 2018 | 2019 | 2020 | 2021 | |
|---|---|---|---|---|---|
| Surviving Infected Individuals | Approx. 12,200 | Approx. 13,500 | Approx. 13,900 | Approx. 14,500 | Approx. 15,900 |
| Consultation-based Individuals | Approx. 11,400 | Approx. 12,400 | Approx. 13,000 | Approx. 13,900 | Approx. 15,000 |
| Treatment-based Individuals | Approx. 10,800 | Approx. 12,000 | Approx. 12,700 | Approx. 13,700 | Approx. 14,500 |
| Treatment Rate | Approx. 92% | Approx. 94% | Approx. 97% | Approx. 97% | Approx. 97% |
| Viral Suppression Rate | Approx. 91% | Approx. 93% | Approx. 96% | Approx. 98% | Approx. 97% |
- Living HIV-infected individuals: HIV-infected nationals reported each year since 1985, excluding those reported dead
- Number of actual patients: The number of nationals treated for HIV/AIDS each year
- Number of actual treated individuals: The number of actual treated individuals among nationals treated for HIV/AIDS each year who have at least one medical record of antiviral therapy (anti-retroviral therapy, ART) prescribed by June of the following year
- Treatment rate: Number of actual treated individuals / Living HIV-infected individuals
- Viral suppression rate: The number of individuals registered through the “Medical Institution Infected Person Counseling Project” whose RNA value from the last examination date of the reference year is less than 1,000 copies/mL* divided by the number of individuals registered with at least one RNA value through the “Medical Institution Infected Person Counseling Project” in the reference year